07
Unit economics
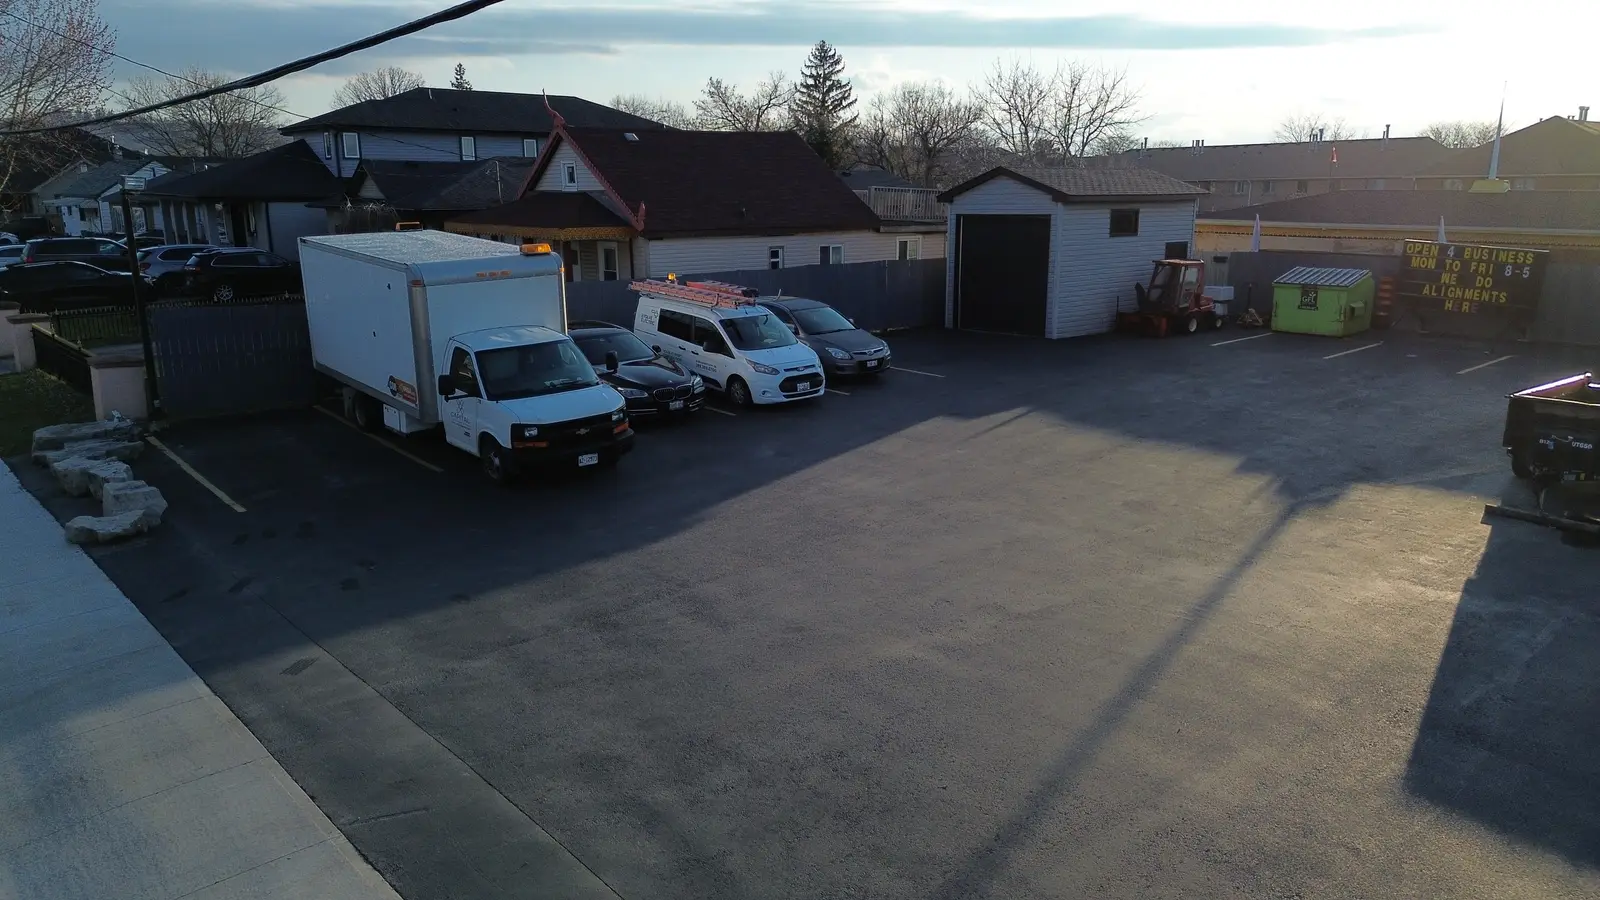 Site photography, the study's own archive. April 2025.
The zero-labor drink store clears its running costs at four cups a day. The problem is paying back the capital, at demand anyone has actually measured.
The per-cup model
The modeled ticket is $6.25 pre-tax, with a $5.49 floor price, which sits at the low-middle of the local drink-price ladder rather than above it.1 At 30 percent cost of goods, one cup contributes $3.87 after processing fees. Processing takes 8.1 percent of revenue on a single-cup ticket, right at the practice’s ceiling, and falls as baskets grow.2
| Line | $ |
|---|---|
| Cup price, pre-tax | 6.250 |
| Charged incl. 13% HST (remitted) | 7.063 |
| Processing (2.9% + $0.30 on gross) | 0.505 |
| Cost of goods (30%) | 1.875 |
| Contribution per cup | 3.870 |
Fixed costs run $450 a month: power including refrigeration and climate, connectivity, insurance, consumable service. No rent is charged in the model, because the structure was already held; a third-party operator should add theirs. No labor is charged, because the format bans it, and the check cuts the other way: one loaded minimum-wage part-timer, at roughly $2,800 a month, exceeds the entire floor-case revenue line.2Break-even is $450 divided by $3.87: 116 cups a month, 3.8 cups a day.
Volume scenarios
| Cups/day | 28% COGS | 30% COGS | 32% COGS |
|---|---|---|---|
| 12 (floor) | 1,007 | 962 | 916 |
| 30 (base) | 3,193 | 3,079 | 2,965 |
| 45 (stretch) | 5,015 | 4,844 | 4,673 |
Capital, fully totalled
The machine-only frame flatters the format. A $15K machine at the 12-cup floor pays back in 15.6 months, inside the study’s 18-month comfort line. But the machine needs a structure around it. The structure’s buildout, priced to the fastener in the program’s bill of materials, runs $17,638 for the walk-in-vestibule configuration and up to $23,720 for the serving-window configuration, permits and contingency included.3 Total capital for the smallest real configuration is about $26,000; with the component build at the top of its range, $37,600.
| Stack | @ 12/day | @ 30/day | @ 45/day |
|---|---|---|---|
| $15K machine only (the flattering frame) | 15.6 | 4.9 | 3.1 |
| $26K vestibule + component build, low | 27.0 | 8.4 | 5.4 |
| $37.6K vestibule + component build, high | 39.1 | 12.2 | 7.8 |
| $60K platform tier | 62.4 | 19.5 | 12.4 |
At the floor case, total-capital payback runs 2.2 to 3.3 years, not the 16 months the machine-only frame suggests. The program’s own kill line was 24 months. Winter makes it worse: at 60 percent cold-month volume with no hot menu line, the floor case’s annualized net falls by about a quarter.2
Then apply chapter 03
Every number above still assumed the floor case: 12 cups a day, every day, from a walk-up window. The category’s best measured operator, mature, in a captive venue, with a decade of iteration behind the machine class, serves 6.8. The floor case is not conservative; it requires beating the category’s best documented steady state by 75 percent from a cold start. The 30 and 45 cup columns, where the larger stacks become rational, have no measured comparable anywhere in the public record.
The model fails on demand, not margins: left of the measured line, no total-capital stack pays back inside six years, and the counted evidence that would move the model right of it does not exist.
Notes
- Local price ladder surveyed 2026-07-13/14 across chain menus in the trade area: the modeled $5.49 floor undercuts every found comparable line; $6.25 sits between mid-ladder chain prices. Ontario bubble-tea range roughly $5–8, premium lines to $8–12.
- The program’s unit-economics model, recomputed independently at close-out from first inputs (ticket, HST, processing 2.9% + $0.30, COGS 28/30/32%, fixed $450/mo, 30.4 days/mo), July 2026. Winter sensitivity modeled at 60% volume (no hot line) and 80% (hot line) for November through March.
- Buildout bill of materials, July 2026: walk-in vestibule configuration $17,638 all-in (60A panel variant); serving-window configuration to $23,720 (100A variant); both include a 12% contingency on physical goods and $2,040 of permits and fees.